Daemonitor

Local process visibility for busy Gradle machines

Activity Monitor for your Gradle and Kotlin daemons

See what's building right now, what built recently, and which IDE, terminal, or AI coding agent triggered it.

Daemonitor Live Monitor showing active Gradle daemons, wrappers, Kotlin daemons, and test workers with RSS, CPU, and uptime

Why Daemonitor

Modern agentic workflows run Gradle from many places at once. Daemonitor gives you one local Activity Monitor for Gradle and Kotlin daemons.

  • Concurrent triggers IDEs, terminals, scripts, and coding agents can all start Gradle builds at the same time.
  • Hidden load Daemons and test workers can consume significant CPU and memory without an obvious owner.
  • Local clarity Get a simple view of current processes and recent builds without leaving your machine.

Feature highlights

Live processes, a terminal CLI, memory timelines, and searchable build history — including AI-agent attribution.

Live state

Live Monitor

Watch every Gradle-related JVM as it runs: daemons, wrappers, Kotlin daemons, and test workers, with RSS, CPU, uptime, process details, and memory-pressure indicators.

  • Gradle daemons, wrappers, Kotlin daemons, and test workers
  • RSS, CPU, and live uptime
  • Process and JVM details with concurrent-build indicators
  • Memory-pressure badges when usage climbs
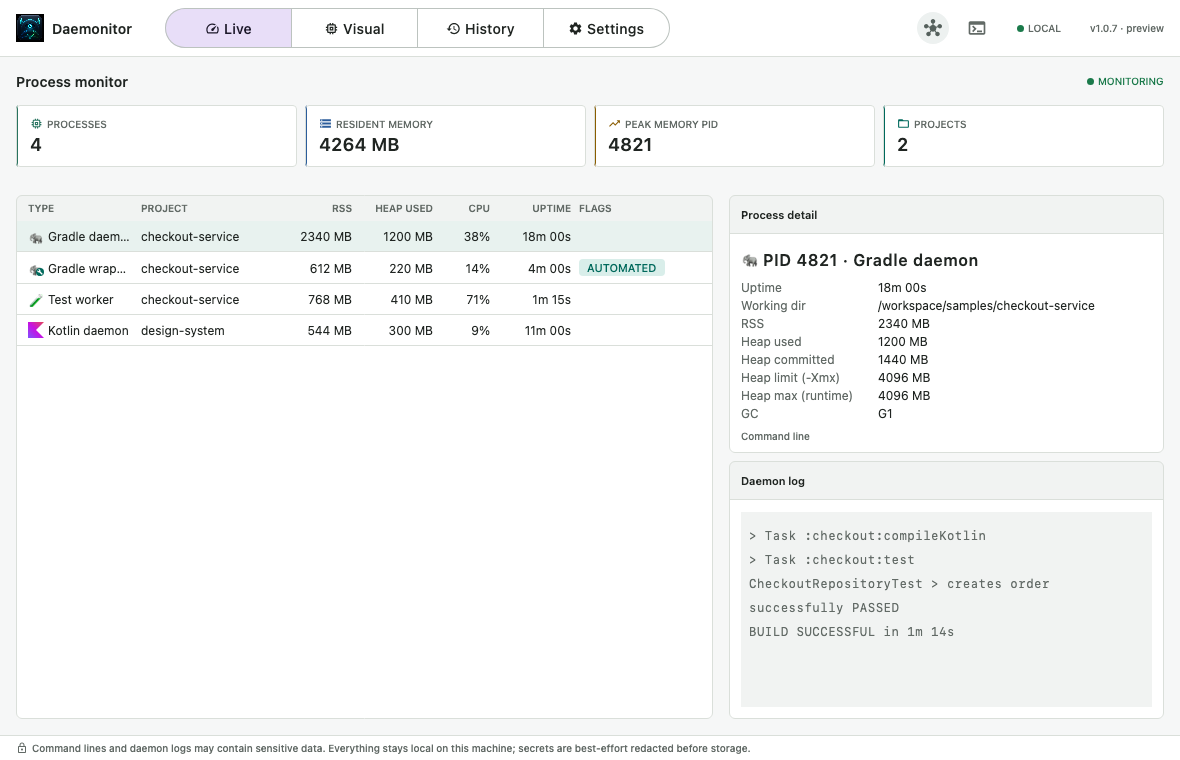
Daemonitor Live Monitor with process list, status badges, and selected daemon inspector

Memory timeline

Visual

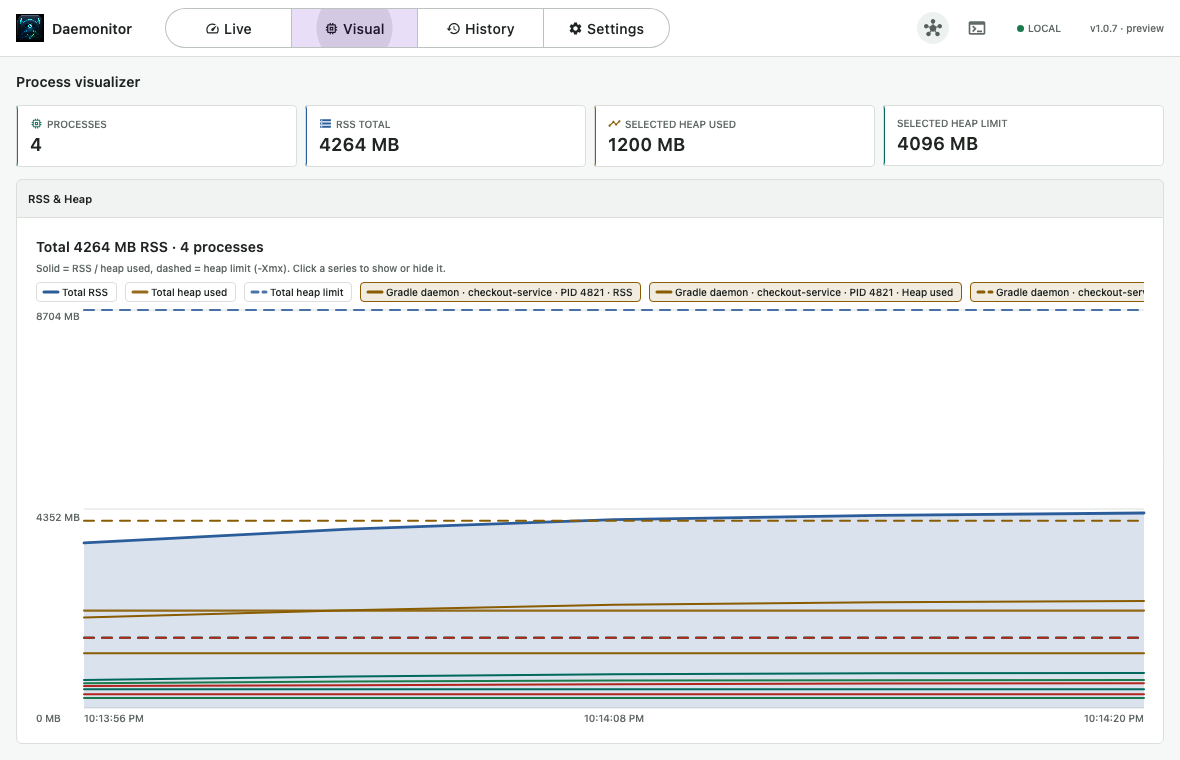
See rolling RSS timelines alongside configured heap (-Xmx) so concurrent Gradle processes are easy to compare at a glance.

  • Rolling RSS timelines across live processes
  • Configured heap / -Xmx when recoverable
  • Memory usage across concurrent Gradle processes
Daemonitor Visual tab showing rolling RSS and configured heap timelines for concurrent Gradle processes

Retained history

Build History

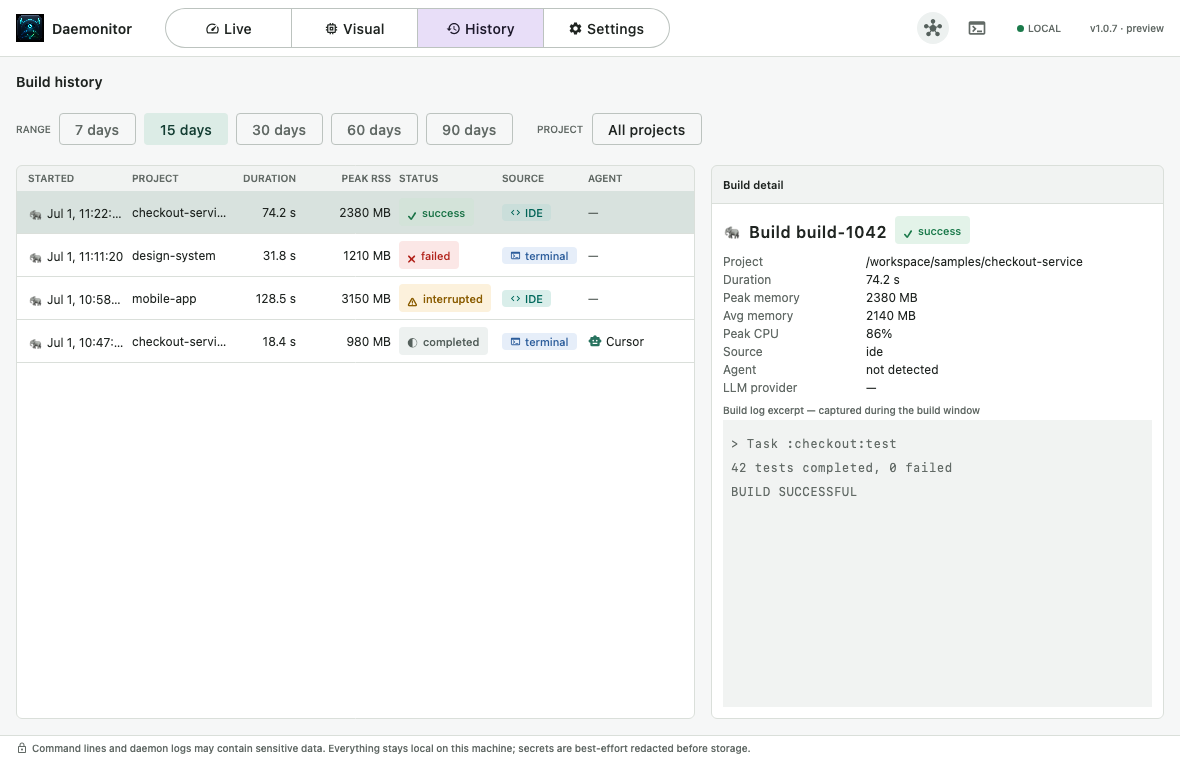
Browse recent builds with duration, outcome, peak resources, source, and AI-agent attribution — then search history when you need the details.

  • Recent builds with duration and outcome
  • Peak resources and invocation source
  • AI-agent attribution when a coding agent triggered the build
  • Searchable retained history
Daemonitor Build History listing recent builds with outcomes, source tags, agent attribution, and peak resources

Terminal

CLI

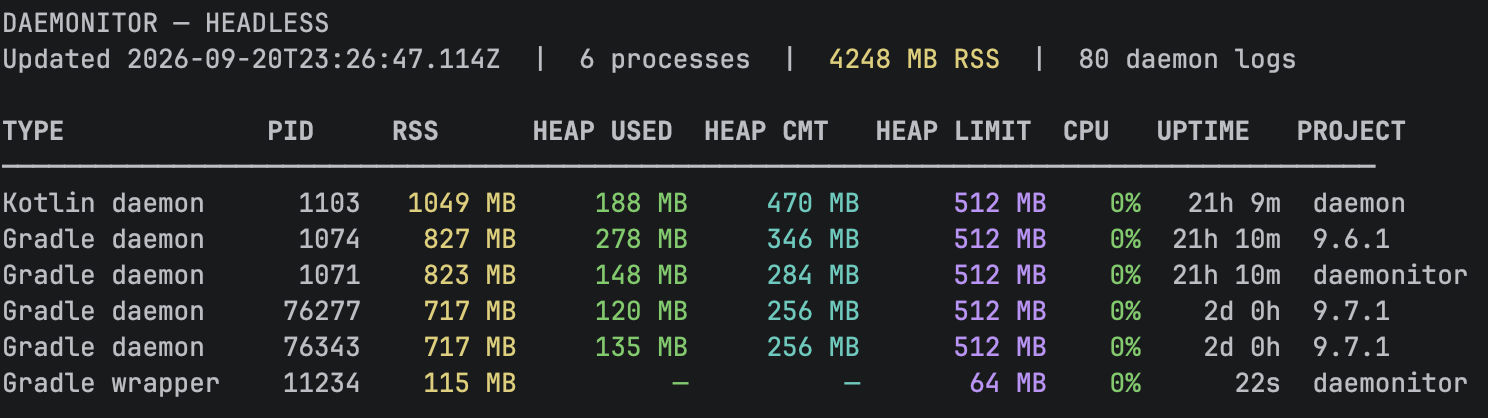
The same live monitor in your terminal — for SSH sessions, build machines, and anyone who prefers a lighter footprint than the desktop window.

  • Live process table with RSS, heap, CPU, and uptime
  • Shares the desktop app’s local database and retention settings
  • Install with Homebrew, or grab the release zip
brew tap cdsap/tap
brew install daemonitor-cli
daemonitor-cli

Needs JDK 21. Flag reference: CLI options.

Daemonitor CLI terminal showing Gradle daemon, Kotlin daemon, wrapper, and test worker rows with RSS, heap, CPU, and uptime

Local agent access

MCP / Agent workflows

Daemonitor can expose a local, read-only MCP interface so compatible tools inspect retained build history and currently visible Gradle processes — without sending data off your machine.

Your build data stays on your machine.

Daemonitor is local-first by design. Privacy is a product feature, not a settings toggle.

  • No telemetry — nothing is phoned home about your builds or machine.
  • Local SQLite storage — history lives in a database on your computer.
  • Best-effort redaction — command lines and logs are redacted before storage.
  • Local read-only MCP — agent access stays on localhost and cannot mutate builds.

Download

Packaged desktop builds are ready for macOS, Windows, and Linux. Prefer the CLI for a terminal-only install via Homebrew or the release zip.

Desktop links open the latest GitHub Release so the page never hardcodes a stale version. CLI install steps are in the CLI section.